 There’s no denying the grip infographics have on us. These bite-sized, data-packed, visual stimulants have become a news source in their own right. They’re easily shared, easily consumed – not to mention easy on the eyes.
One startup that’s been there since the beginning of this infographic heyday is Visual.ly. The company got its start with the help of design-heavy financial app Mint, where founders Lee Sherman and Stew Langille would translate money-related data (which, to put it kindly, it’s the most exciting stuff on earth) into colorful, fun, informative graphics. From there, Visual.ly was born, since positioning itself not only as a go-to for infographics but also as a hub for users – as well as talented designers – to flex their creative powers.
Now, Visual.ly, which sees about two million visitors a month, is taking the next step in its platform dreams by launching its Marketplace to match infographic creators with interested outlets. “This is the biggest launch we’ve had since originally launching the company,” says Langille, who serves as CEO. “It brings together the community we’ve carefully developed over the last year and a half.” Visual.ly has already become a place for designers to find new jobs, but now it’s refining the management and process behind all this.
Langille says Visual.ly has amassed some 50,000 designers, thousands of data journalists, and data analysts, and the site’s new marketplace will play matchmaker by connecting them with the clients who want what they’re selling. And the demand is high: Visual.ly says commissioners, generally brands and agencies (including the likes of The Economist, Pepsi, and CBS) are hungry for a piece of the infographic action.
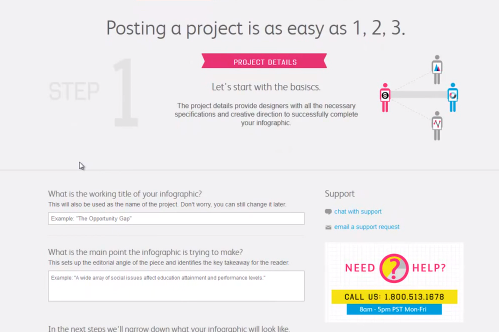
The marketplace isn’t just a one-stop infographic shop, either: Commissions and creators are connected based on Visual.ly’s algorithm, which reads design and graphic tastes to find the best match. “We get as much information as we can on the style that [commissioners] are looking for so we can match them with the designers and creators best suited to them,” Langille tells me. Clients can pull in whatever sort of documentation they want – Excel files, Google Docs – in order to get their project started.
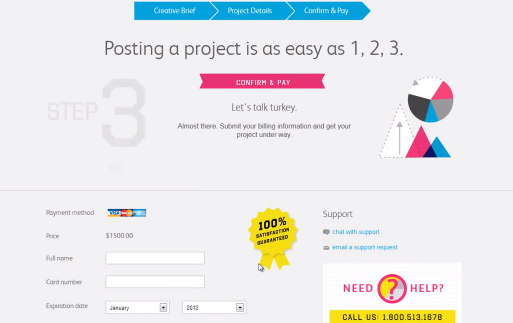
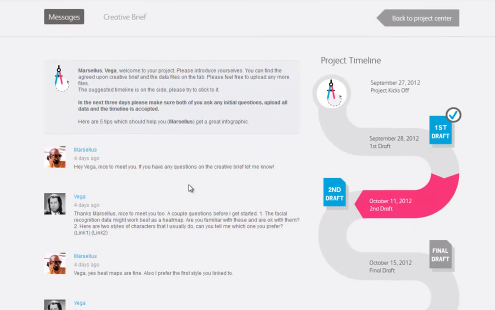
 From there, designers and commissioners are set up with the platform’s project management system and led through the creation process, where feedback and changes can be logged and tracked. Drafts can be uploaded and approved as well, all in real-time. It’s all presented in a timeline format, where both parties can set and use deadlines and adhere to budget and timing constraints. Visual.ly also handles payments through its system (part of the project will be paid up front to ensure creators get paid).
 What Visual.ly’s trying to do here is make the infographic smarter. While they’re inarguably popular, jury’s still out on its effectiveness. There’s some criticism that our love of these drive-by data visualizations means more and more poorly-sourced, ill-conceived, misleading, and downright false infographics are virally spreading around the Web.
And let’s face it, exclusivity can have its benefits. Infogr.am is one application that puts infographic creation into any and all users hands, and while that snappy premade template with your own supplied info might impress your coworkers or look real nice on a term paper, there’s something to be said for the research-hungry, data-happy journalists and analysts who make sourcing their livelihood and what they can do for the medium.
Of course, using these resources is optional: There will be different options, depending on a commissioner’s needs. You can supply data yourself, or bring in journalists and analysts to help you craft your story. Still, quality and originality are of the most important, and Visual.ly promises a 100 percent money-back guarantee – and with infographics starting at around $1,500, they’re wise to. “We’ll let the community dictate this price,” Langille says. “This is just the launch price, we’re trying to establish this but the market will determine where the price is set. We’re going to be very flexible, we just wanted some structure at launch.”
It might sound steep, but it makes Visual.ly a legitimate option for graphic artists and data types who need an outlet for their work. And given the design-hungry state our Web is currently in, following this trend isn’t a bad bet. The Visual.ly marketplace opens its public beta today, you can sign up to create or commission work here.