The coronavirus pandemic has brought with it, among other things, a deluge of information and a whirlwind of constant breaking news updates. Keeping up with the latest news on COVID-19’s spread can be overwhelming and stressful, but there is a way to aggregate much of that data and help you make sense of it at the same time: Dashboards.
Dashboards can vary in format, but many of them feature frequently updated maps, graphs, and/or statistics that can help you keep up with how far the coronavirus has spread, which countries have been affected, and how those countries have fared in dealing with COVID-19 so far.
We found six helpful and reliable coronavirus dashboards and then divided them into categories based on your statistical needs. Whether you just need a quick glance at an easy-to-read pandemic map or are looking for a more in-depth visual guide to how the coronavirus pandemic has developed over time, you can find what you need among the dashboards listed below.
Updated the most often
Johns Hopkins University’s Dashboard
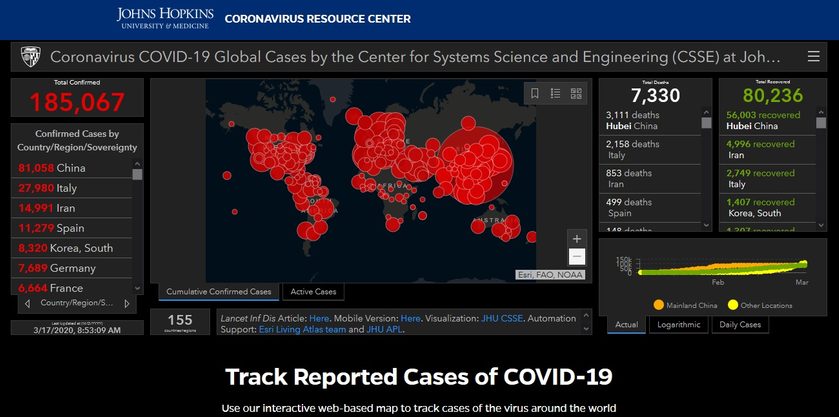
Johns Hopkins University’s coronavirus dashboard is the one on this list that most resembles an actual dashboard. But that’s not why we included it. We chose this dashboard because it was easy to navigate and read, and more importantly, because it was the most frequently updated coronavirus dashboard we found. In fact, according to the dashboard’s FAQ section, the map itself is “maintained in near real time throughout the day through a combination of manual and automated updating.”
And the data featured in this dashboard comes from a wide variety of reputable sources including: the World Health Organization, the U.S. Centers for Disease Control and Prevention, the European Center for Disease Prevention and Control, National Health Commission of the People’s Republic of China, and local health departments, just to name a few. It is worth noting however, that since the data comes from so many different sources, it’s possible that this dashboard may report higher numbers of COVID-19 cases than other sources, which Johns Hopkins notes may be due to the fact that other sources are “updated less frequently.”
Puts breaking (pandemic) news in perspective
BBC News’ Visual Guide to the Pandemic
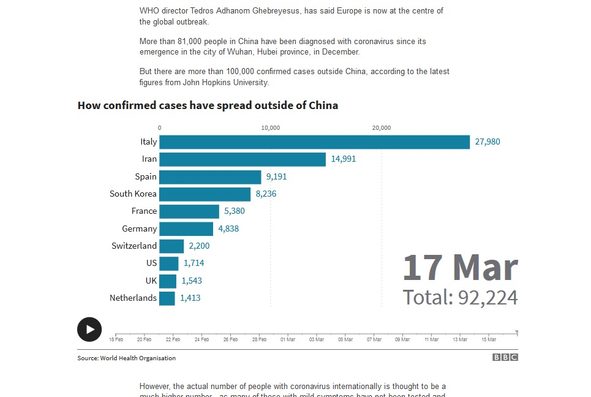
The BBC’s visual guide to the coronavirus pandemic doesn’t quite look like a dashboard, but it does a great job of aggregating and organizing massive amounts of public health data into frequently updated, bite-sized maps and graphs. And on top of that, the maps and graphs are arranged in such a way that clearly illustrates the main takeaways of the rapidly unfolding story that is the coronavirus pandemic. Which is particularly helpful for everyone hoping to understand such a big, impactful story that’s being reported at the frenetic pace of a 24 hour news cycle.
News and statistics
The New York Times’ Coronavirus Map
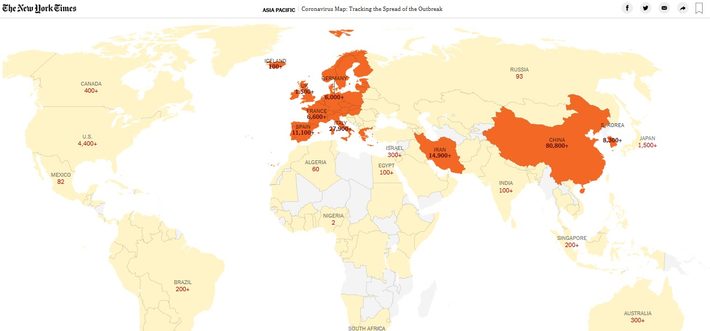
Similarly to the BBC’s visual guide to the pandemic, The New York Times Coronavirus Map site features a number of frequently updated maps and graphs that display the current public health data available about the spread of coronavirus. Furthermore, the Coronavirus Map site also offers a summary of the latest news related to COVID-19 to help provide context for all of this data. Unlike the BBC’s visual guide, however, this dashboard is a bit more user friendly as it allows you to toggle between the different maps and graphs by selecting from a menu of links at the top of the article, instead of just having to continuously scroll through to find the map or graph you’re looking for.
Provides health guides along with statistics
Centers for Disease Control and Prevention’s Dashboard
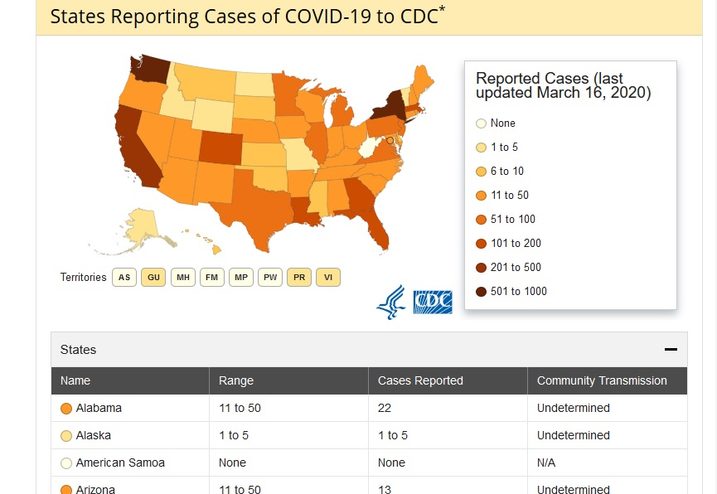
The United States Centers for Disease Control and Prevention also has its own COVID-19 dashboard, which provides detailed information on the spread of coronavirus (especially as the data relates to the United States). But this dashboard’s value isn’t so much about the statistics and maps it provides. It has more to do with the fact that the CDC provides this data in conjunction with trustworthy health guides and tips on how to deal with the coronavirus as an individual. And that’s useful because sometimes infection case numbers aren’t necessarily the only information you need. It’s important to have an idea of how many reported cases of coronavirus there are in your state, but it’s also equally important to know how to protect yourself from becoming another statistic.
That said, it’s also worth noting that, while the CDC is reputable source of public health data on the matter, their online dashboard isn’t updated as frequently as others on this list. In fact, the CDC notes at the top of its dashboard site that the page is only updated Monday – Friday at 12:00 pm (most likely ET).
Easiest to read and use
Microsoft’s Bing COVID-19 Tracker
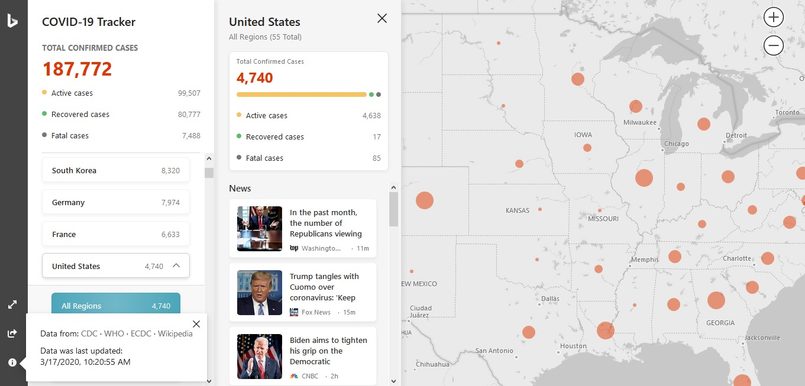
Microsoft has developed its own coronavirus dashboard and it’s called the Bing COVID-19 Tracker. It has an easy-to-use, clean and minimal interface that actually hides a wealth of information and data. In fact, as you click through its intuitive interface, you can view public health data on the pandemic that’s first broken down by country and then in some cases by state. Then after selecting a country from the left side of the screen, you can see a quick breakdown of the “total confirmed cases” including deaths, recoveries, and active cases. The dashboard also provides related links to news coverage for each country as well.
But while the Bing COVID-19 Tracker does cite a number of reputable public health sources for its data, it also cites Wikipedia among its sources as well. And so you may want to compare its findings with the other dashboards on this list to get a more accurate understanding of the case numbers.
World Health Organization’s Dashboard
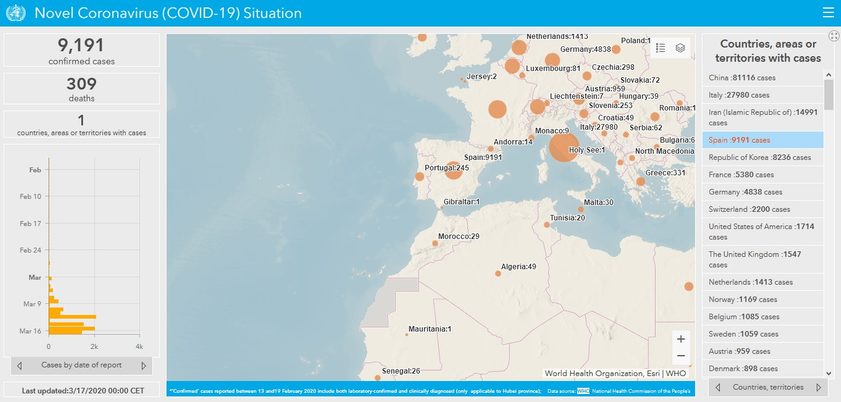
You don’t always need detailed public health data and graphs. Sometimes you just want a quick look at the current state of the pandemic. And while the World Health Organization’s COVID-19 dashboard may not be as frequently updated as other dashboards on this list, it is one of the easiest ones to read. This dashboard features a clean, uncluttered interface, with basic case number breakdowns for each affected country, and even a timeline graph showing when the cases were reported. And clicking through each country instantly results in a zoomed in version of the map, without you having to adjust the map yourself to read the parts you want to focus on. It’s one of the best at-a-glance maps of the coronavirus’ spread we’ve seen.