
With 2012 behind us and 2013 just begun, consumers are being pummeled with stories about last year’s biggest winners and losers in tech, along with predictions for the year ahead. Is Microsoft’s Surface RT a success or a flop? Are Nokia’s new Windows Phone 8 devices selling well enough to bring the company back from the brink of irrelevance? Will Amazon’s Kindle Fire HD be able to tackle Apple’s iPad — and the iPad mini?
While some pundits draw conclusions from no more than a gut feeling, most will bolster their arguments with numbers, figures and other facts. But who’s generating this data? Do the numbers mean what people think they mean? How are the numbers sometimes bent to paint a particularly rosy (or dire) picture – and mislead consumers?
From the horse’s mouth

The most direct route to information about a company’s products come directly from the company itself. Public companies all over the world are required to make regular disclosures about their activity and finances, and usually do so four times a year. Since misrepresenting or falsifying this information can lead to lawsuits, penalties, or even arrests (as Olympus found out this year) they tend to be reliable. However, even reputable companies have been known to engage in creative accounting (like deferring revenue, selling assets, and tallying up intangible “goodwill”) to make a particular snapshot of their financial status look as rosy as possible. So financial figures might arguably be true, but they can also reflect some degree of spin to keep investors on board.
Technology and consumer-electronics companies are not required to disclose how much of a product they sold, just their revenue. Sometimes they have good reasons. For instance, mobile operators and pay-TV services usually talk about subscribers rather than sales since they’re really selling services, and keeping subscribers on board (“reducing churn”) is often an indicator of customer satisfaction. Other times, it’s because they don’t want to be compared directly to competitors who do disclose sales information. For instance, Amazon has never released information about sales of Kind e-readers or Kindle Fire tablets, issuing only vague statements that sales are in the “millions” and the products are Amazon’s most popular.
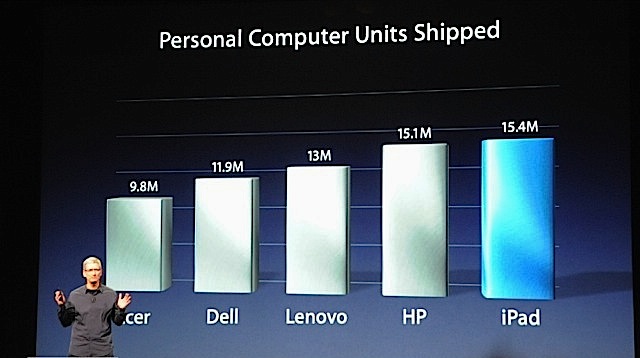
“Shipped” versus “sold”
For companies that do talk about sales, it’s important to distinguish the number of units they shipped versus the number they have sold. Apple famously reports iPhone, iPad, Mac, and iPod sales every quarter, disclosing the rough number of devices that have been purchased by consumers. Apple can do this, in part, because it makes only a small number of products.
Other companies sometimes report on the number of products they have shipped: Units that have been manufactured and left factories, but could be be sitting in warehouses or retailer inventories. News outlets sometimes treat products shipped more-or-less the same as products sold: After all, retailers wouldn’t have ordered them if they didn’t reasonably believe they could sell them, right? But the distinction sometimes comes back to bite companies, like Samsung with its first Galaxy Tab and Logitech with the Google TV-powered Revue. Unsold product sitting in inventory is a liability to companies, who may have to buy back, landfill, or (most likely) seriously discount unsold products to get rid of them. Each case impacts their bottom line and market share.
Aren’t we awesome?
Companies sometimes disclose useful information separately from business updates and required filings. For instance, Google offers weekly snapshots of the distributions of Android devices that connect to Google Play, providing some insight into Android’s oft-lamented fragmentation. Google’s Eric Schmidt noted in September that Google was activating 1.3 million Android devices a day. Following on the success of Apple’s App Store, companies from Google to Amazon, Microsoft and RIM are touting the sheer numbers of apps they make available to their customers, and those numbers are broadly used as indicators of activity and developer interest in a particular platform.
Who watches the watchers?
Direct information from companies is all well and good, but almost always comes without context. When Apple discloses iPhone sales, it doesn’t say anything about the rest of the smartphone market (or mobile phone) in the United States or the rest of the world. Neither do other phone makers, since that information may not show them in the best possible light.
Third parties like Gartner, IDC, and IHS iSuppli pick up the task of comparing across companies. At a very basic level, they attempt to assemble and collate information about product sales and shipments from many sources and assemble it into a picture of an entire market.
These firms often have the unenviable task of comparing apples to oranges. For instance, if Samsung claims to have shipped a certain number of tablets worldwide, how does that compare to the number of iPads Apple sold worldwide? And what if manufacturer’s fiscal calendars don’t line up? One way to answer question like that might be to talk to retailers, but that means talking to literally thousands or retailers, many of which are contractually bound not to disclose sales information about particular products or brands. What if a company (like Google or Amazon) doesn’t even disclose how many products it shipped? Then market analysis firms have to try talking to their suppliers, working up estimates based on things like their orders for screens, batteries, memory, and other components.
Not even deciding which products share the same market is always cut and dry. For instance, Strategy Analytics drew fire last year for considering dedicated e-reader devices like the Nook Color (and virtually anything else running Android that wasn’t a smartphone) to be a tablet competing with Apple’s iPad. Meanwhile, others consider tablets like the iPad personal computers.
The important thing to remember with numbers from market analysis firms is that they represent, at best, an educated guess. These companies’ clients are not everyday consumers, but rather investment firms and (often) the companies they’re reporting on. After all, you can bet companies like Sony, LG, Motorola, and HTC want all the data they can get on how their competitors are doing. And these firms sell their comprehensive reports to these customers at top dollar: they may only sell 50 copies, but if they go for $8,000 a pop, that helps pay for the footwork it takes to compile them.
Survey says…

Another way to figure out what’s happening on the ground is to simply ask consumers what they think. Researchers identify a group, select enough of them at random, and ask them quantifiable questions (“Which do you prefer, Coke or Pepsi?”), then hope the results from that random sample reflect the group as a whole. Some of the best-known research companies in the technology and consumer electronics markets are Nielsen, Gallup, and the Pew Internet & American Life Project.
Surveying more people produces more accurate results. So how many is enough? Using true random selection, interviewing 500 people in a large population will give you a margin of error of about 5 percent either way. Interviewing 1,500 people reduces the margin of error to about 2.6 percent — a dramatic improvement. You might expect interviewing 2,500 people would reduce error to about 1.2 percent, but the margin of error decreases on a curve. You’d have to interview 5,000 people to get the margin of error down to 1.4 percent. Since surveying people is time-and-money intensive, 1,500 respondents is usually considered the sweet spot for polling.
Random selection is key to accurate surveying – those margin-of-error figures are based on true random selection. Unfortunately, surveyors can’t force people to participate, so respondents are almost always self-selecting, not random. Various survey methods also have their own constraints. For phone surveys, respondents may have to speak English, have a landline, be willing to answer calls from strangers, be over 18 years old, and not be in the military or institutionalized — and you’re not likely to interview anyone who is deaf. For online surveys, users have to be willing to follow links (or sign up with a survey firm), read English, and have Internet access as well as compatible hardware and software. Issues like these all introduce bias. For every compromise a survey makes on pure random selection, surveyors need to interview more people to be reasonably assured they’re getting decent data, or they need to fudge their data based on educated guesses about how their respondents are different from the general population. Many do both.
Unless they reach an entire population, surveys can never prove anything. At best, a well-conducted survey can assert that it is likely the results represent the population as a whole.
All your clicks are belong to us

Given the hassles of good surveying, it’s no surprise companies like to gather as much data as they can automatically. If you make a purchase at a major retailer (in a store or online), the odds are pretty good that sale is being reported to retail monitoring firms. That’s why reports on Black Friday sales appear before Cyber Monday rolls around.
However, all the same sample bias problems apply: knowing what people bought at Sears doesn’t necessarily say anything about what people bought at Best Buy, let alone the funky independent toy store down the block. The techniques often leave out local businesses and small retailers, and there’s no way to determine whether particular businesses using retail monitoring are representative of retail activity as a whole.
Browser and search engine usage gather data too, although methods and practices vary. Services like Comscore and Nielsen have large networks of volunteers with special software installed on their PCs or devices that reports data back to the companies. Outfits like Statcounter and Chitika don’t install software on user’s systems, but their clients install code on their sites that provides a service. (StatCounter collects usage information for site operators; Chitika serves up ads.) They can usually tell if someone navigated to a page from a search (along with what search engine they used), as well as what browser, version, and operating system they’re using.
All these techniques fail the random-selection test, but try to make up for it in pure volume. For example, Chitika is one of the smaller networks, and it claims to span more than 200,000 sites and process 4 billion requests a month; StatCounter says it’s installed on more than 3 million sites worldwide. Nielsen says its panel spans half a million people worldwide; Comscore claims 2 million.
Requiring users to install software on their systems introduces a strong selection bias, especially since none of the software can run on any device. Collecting information from services providers doesn’t have this issue, but there’s no way to say whether the sites collecting data for them are representative of the broader Internet. Many sites including non-profits (like Wikipedia), schools, and businesses don’t run ads, so large swaths of the Internet are omitted from Chitika’s approach. Some of the Web’s savviest users install add-ons like Ghostery, DoNotTrackMe, or Adblock Plus to avoid being tracked, which will usually block things like StatCounter and Chitika, further skewing results. How much? The makers of DoNotTrackMe estimated (PDF) some 28.1 million Americans will be running anti-tracking tools by the end of this year – roughly 9 percent of the population.
Bottom line
No matter how unbiased their intentions, all researchers must battle a number of factors that can accidentally color their findings. That’s not even accounting for the particular spin or intent of the parties that pay for these numbers and trumpet them from the mountain tops.
This is not to say market analysis firms, survey companies, or Internet usage trackers are trying to mislead people. Most are trying to present as truthful a picture as they can. However, these are tough problems, and the figures are all fuzzy to some degree. How much? It’s unknowable: might be a little, might be a lot.
Always consider the source of facts and figures about the technology industry, and ask yourself how those numbers were tallied up. The answers are usually less conclusive than you’re being led to believe.
Images via Shutterstock / alphaspirit; Shutterstock / Petya Nikolova Petrova; Shutterstock / Alex Mit