  1. Home
  2. Social Media
  3. Web
  4. Legacy Archives

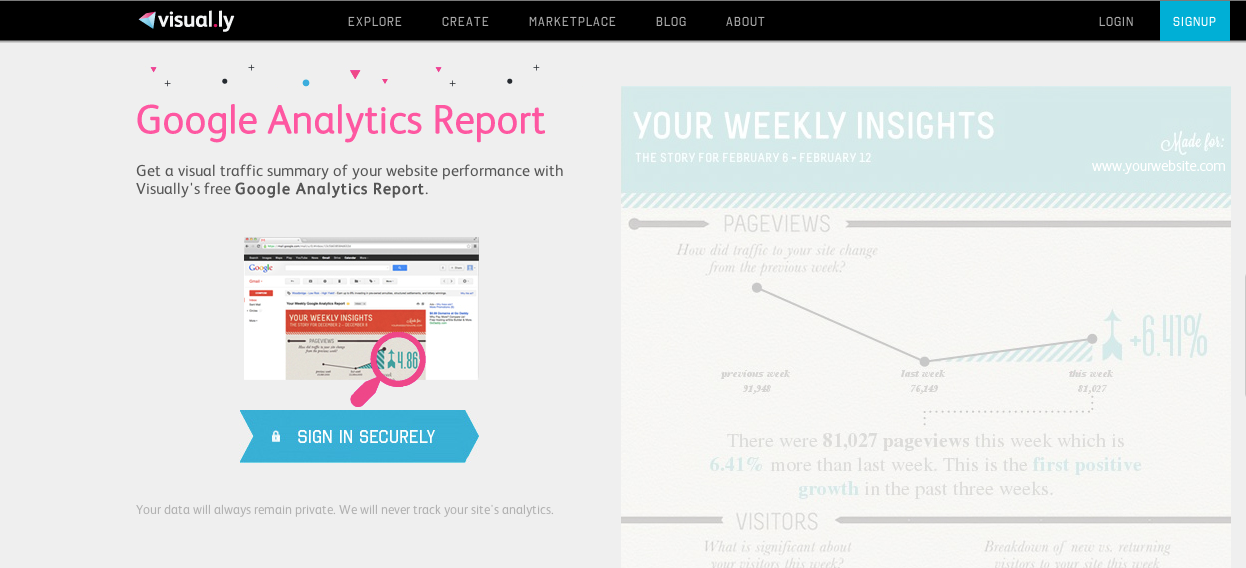
Get your Google Analytics in infographic form thanks to Visual.ly

Add as a preferred source on Google
Screen shot 2013-03-23 at 11.45.02 AM
Image used with permission by copyright holder

Self-proclaimed social media gurus have a new tool to their arsenal. (And so does the person a little too busy to keep up with analytics for his or her Twilight fanfiction site.)

Visual.ly, the website that makes infographics a lot easier to make before (and also brought you the uber-fun Twitter Showdown now makes understanding Google Analytics easier than ever.

Recommended Videos

The new (and free!) feature which creates a snappy and aesthetically pleasing snapshot of page views, visitors (including new and returning ones), time and pages per visit, how Facebook and Twitter-adored your website is, bounce rate and organic search results. All you have to do is add the Google Analytics code into your site (if you haven’t already), create a Visual.ly account (if you don’t already have one), grant Visual.ly access to your Google Analytics, and then voila! There are also buttons that allow you to share the report quickly. 

The Next Web produced a full report on their site which can be seen below:
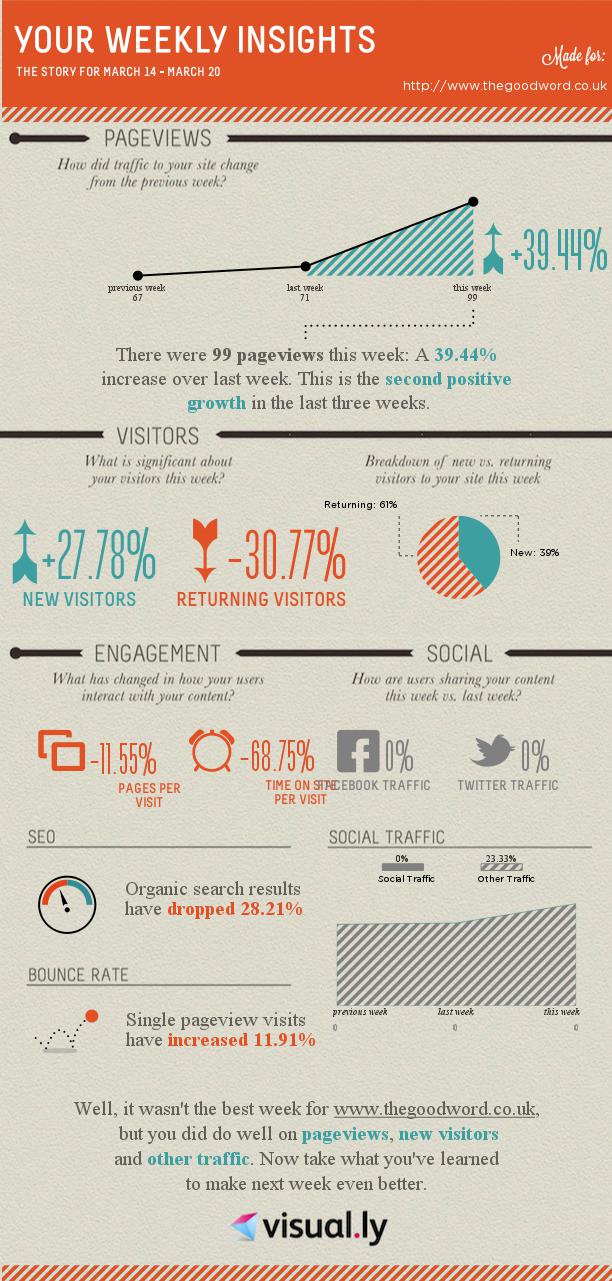
via The Next Web.
via The Next Web Image used with permission by copyright holder

You won’t find information on which specific pages are doing the best or even which search terms are bringing people to your site on your quick report, however. 

This won’t offer you the real drill-down and real-time analytics paid tools will, but those can get pricey fast. Chartbeat, for example, offers real-time analytics (which Google Analytics does not) and is relatively cheap at $10 a month for the basic plan and way more for upgrades. And while Visual.ly’s graphic certainly is nice to look at, don’t forget that there are many other Google Analytics reporting tools which churn out eye-pleasing (though mostly much more corporate looking) graphics like line graphs of page views and pie charts of traffic sources. Most of these cost money (after a free trial period) but many are much more powerful than Visual.ly’s tool. 

But for those looking to humble-brag to friends or employers about page views, or are just a little curious and don’t want to slog through loads of Google’s Verdana 12-point, life just got a little easier and prettier. And if that’s not simplified enough, Dreevoo produced a step-by-step how-to on the topic.

Visual.ly currently only offers a weekly report option – yes, that means no daily, monthly, or every full moon. For simplified reports on that kind of stuff, you’ll still need to pony-up the cash.

Jenny An
Former Digital Trends Contributor
Jenny writes about technology, food, travel, and culture. She lives in Brooklyn with a MacBook that is like a pet. She has…
Topics
Meta’s latest courtroom losses expose a potential hole in social media’s strongest defense
Plaintiffs are treating engagement features as deliberately designed products, an argument that could make Section 230 far less useful
facebook

Two jury losses have given plaintiffs momentum against Meta, but they haven’t rewritten the rules for social media. One case relied on New Mexico consumer-protection laws. The other asked a California jury whether addictive design contributed to a young woman’s mental-health issues.

The verdicts, detailed by The Wall Street Journal, reached Meta through different legal routes. Together, they suggest Section 230 becomes a less dependable shield when a lawsuit centers on choices made by the platform itself.

Read more
Meta AI is moving into your Threads DMs, where awkward AI chats belong
Because not every AI conversation deserves a spot on your followers' timeline.
Meta AI in threads DM

One of the reasons Grok AI became so popular is because it let people chat with it directly on X, resulting in some hilarious conversations. And while the public availability of Grok AI on X has resulted in numerous safety issues, there's no denying that this openness played a major role in its rise. 

It seems Meta wanted the same, which became evident when the company started testing Meta AI directly on Threads a few months ago, letting users chat with it right in their feed. But not everyone was comfortable having those conversations out in the open, so Meta has just moved its Meta AI inside your Threads’ DMs. 

Read more
X Money is finally here, and it’s much more than a digital wallet
The new financial service aims to turn X into an app where users can pay, save, spend, and send money.
X Money featured

Elon Musk's vision of turning X into an "everything app" has taken another major step forward. The company has officially begun rolling out X Money to Premium and Premium+ subscribers in the United States. Rather than being just another digital wallet, X Money is designed as a full-fledged financial hub built directly into the social platform, allowing users to send money, receive payments, hold cash, earn interest, and spend through a Visa debit card—all without leaving the X app.

What is X Money, and who is it for?

Read more