
See the entire observable universe represented in this interactive map

If you’ve ever wanted to bask in the cosmic majesty of all that exists or feel the existential horror of your own smallness, a new interactive map will show you the entire observable universe.

You can view the map at mapoftheuniverse.net, where you’ll find an overview of the types of objects which are visible and a timescale explaining how what is visible is related to its age due to the speed of light. If you’ve ever struggled to comprehend the relationship between time and distance in what is observable, this tool is helpful in showing that.

Related Videos
Visualization of the observable universe, using data from the Sloan Digital Sky Survey.
Visualization of the observable universe, using data from the Sloan Digital Sky Survey. Visualization by B. MéNard & N. Shtarkman

The idea was to make something accessible to the public rather than highly technical, the creators said. “Astrophysicists around the world have been analyzing this data for years, leading to thousands of scientific papers and discoveries,” map creator Brice Ménard, a professor at Johns Hopkins, said in a statement. “But nobody took the time to create a map that is beautiful, scientifically accurate, and accessible to people who are not scientists. Our goal here is to show everybody what the universe really looks like.”

The map uses data from the Sloan Digital Sky Survey, a project to create a 3D map of the universe using a telescope at Apache Point Observatory in New Mexico. Running in various forms since 2000, data from the survey has been used to study everything from how galaxies are distributed across the universe and where dark matter might be located to the properties of stars in the Milky Way.

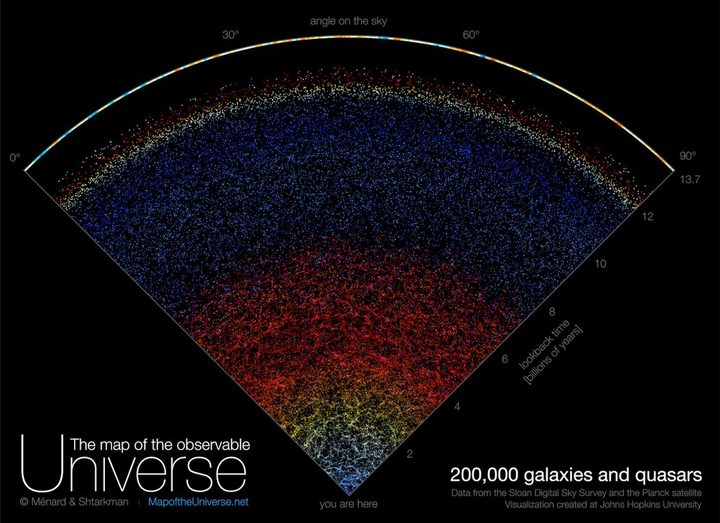
Data from the survey covering a particular slice of the sky was used to make the map, which shows 200,000 galaxies, each one appearing as a small dot. Right at the very bottom of the map is a dot corresponding to the Milky Way.

“In this map, we are just a speck at the very bottom, just one pixel. And when I say we, I mean our galaxy, the Milky Way which has billions of stars and planets,” Ménard said. “We are used to seeing astronomical pictures showing one galaxy here, one galaxy there or perhaps a group of galaxies. But what this map shows is a very, very different scale.”

As well as visualizing the scope of the observable universe, the map also uses color to demonstrate the redshift of different galaxies, with more distant galaxies appearing redder because the expansion of the universe stretches the spectrum of light coming from them.

“Growing up I was very inspired by astronomy pictures, stars, nebulae and galaxies, and now it’s our time to create a new type of picture to inspire people,” said Ménard.

Editors' Recommendations

SpaceX shares stunning ‘blue marble’ footage of Earth
Earth as seen from a SpaceX Falcon 9 rocket.

SpaceX recently shared some stunning footage captured from the second stage of its workhorse Falcon 9 rocket.

The clip (below) shows Earth from thousands of miles away, with ocean, land, and cloud all clearly visible. Most striking, however, is the planet’s marble-like appearance that brings to mind the iconic "blue marble" shot captured during the Apollo 17 mission in 1972 that gave us one of our first incredibly clear views of Earth.

Read more
Hubble sees the changing seasons on Jupiter and Uranus
[Jupiter: left] - The forecast for Jupiter is for stormy weather at low northern latitudes. A prominent string of alternating storms is visible, forming a ‘vortex street’ as some planetary astronomers call it. [Uranus: right] - Uranus’s north pole shows a thickened photochemical haze that looks similar to the smog over cities. Several little storms can be seen near the edge of the polar haze boundary. Note: The planets do not appear in this image to scale.

Our planet isn't the only place in the solar system with dramatic weather changes. Other planets in the solar system also experience seasons, depending on their distance from the sun, and that affects their climates. One of the many jobs of the Hubble Space Telescope is to monitor the changing seasons on other planets, particularly the larger outer planets which aren't so often observed. And this week, scientist have released their newest views of Jupiter and Uranus, taken by Hubble and showing seasonal changes on the two planets.

Jupiter is far from the sun, so most of its heat comes not from outside but from within. Jupiter is thought to have a very high core temperature, which may be a result of how it was formed but could also be topped up by processes inside the planet. As this heat escapes from the planet's interior, it affects its atmosphere which contains multiple layers and has unusual features like geometric storms at its poles.

Read more
James Webb spots exoplanet with gritty clouds of sand floating in its atmosphere
This illustration conceptualises the swirling clouds identified by the James Webb Space Telescope in the atmosphere of the exoplanet VHS 1256 b. The planet is about 40 light-years away and orbits two stars that are locked in their own tight rotation. Its clouds, which are filled with silicate dust, are constantly rising, mixing, and moving during its 22-hour day.

One of the most exciting things about the James Webb Space Telescope is that not only can it detect exoplanets, but it can even peer into their atmospheres to see what they are composed of. Understanding exoplanet atmospheres will help us to find potentially habitable worlds, but it will also turn up some fascinating oddities -- like a recent finding of an exoplanet with an atmosphere full of gritty, sand clouds.

Exoplanet VHS 1256 b, around 40 light-years away, has a complex and dynamic atmosphere that shows considerable changes over a 22-hour day. Not only does the atmosphere show evidence of commonly observed chemicals like water, methane, and carbon monoxide, but it also appears to be dotted with clouds made up of silicate grains.

Read more