
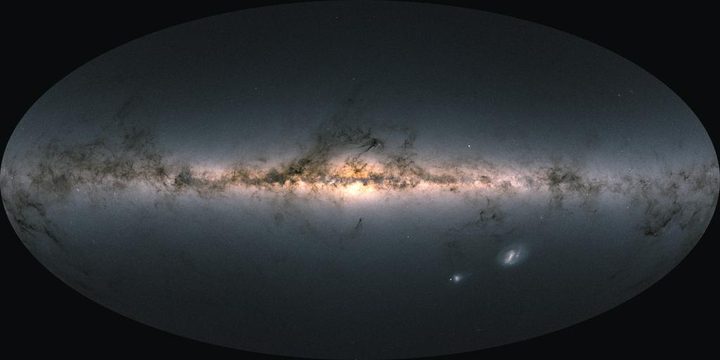
The European Space Agency (ESA) has released the most detailed catalog of our galaxy, using data from the Gaia mission launched in 2013. This three-dimensional map shows the locations of more than 1.8 billion celestial bodies, and you can view an enormous high-resolution image of the data here.
This is technically an early release of the third version of the catalog, an update to the second “galactic census” released in 2018. This release is even more accurate and detailed than before, meaning that even fainter stars can be seen that were not visible before, such as those far out on the edges of the Milky Way or those near to the sun which were previously blotted out by its brightness. The data also includes stars in the satellite galaxies of the Milky Way, called the Magellanic Clouds.
In total, the data of the new release adds up to around 1 petabyte (that’s about a million gigabytes), and it is made available through the European Space Agency’s website where it can be used by researchers in fields from astronomy to machine learning.
“The first two data releases were published in September 2016 and April 2018 and have had a lasting impact on our understanding of the Milky Way’s development,” said Alessandra Roy, Gaia Project Manager at the German Aerospace Center (DLR) Space Administration, in a statement.
“So far, 1.8 billion celestial bodies are listed in the combined data catalog. Measurements relating to the proper motion and distance of the majority of these bodies — approximately 1.5 billion of them — have now been significantly improved.”
The data is valuable as it allows researchers to look at the Milky Way as a whole, helping them to understand more about how our galaxy is structured and how it developed over time. To collect this much data, the Gaia observatory looked at an average of 850 million objects and collected 20GB of data every day.
Gaia’s mission had been scheduled to end in 2019, but as everything on board was still working well, researchers wanted to make the most of this unique observatory and continued to collect data. They now aim to keep Gaia going until 2025, when the gas used to align the spacecraft is expected to run out. Before then, however, there is still the full third data release to look forward to, scheduled for 2022.
“In all likelihood, it will be a long time before we see a space mission comparable to Gaia,” said Roy. “At the moment, scientists are conducting studies with a view to designing an astrometry mission that also covers the infrared region of the electromagnetic spectrum, but the technology required for this has not yet been adequately developed.”


