
If you use Microsoft Excel regularly for studying or work that requires a spreadsheet to be filled with data-driven information, then you know it can be quite difficult and time-consuming to decipher -- even more so for those who are not familiar with analytical-based data.
Whether spreadsheets are complicated or not, the fact remains that graphs help break down your data into an easier to understand format, enhancing the general readability of your Excel spreadsheet.
Here’s how to make a graph in Microsoft Excel.
Inserting a graph in Excel
Step 1: You’ll need to add your data into the Excel spreadsheet, with each column having its own dedicated title. If you make a mistake with the column heading order, just redo or add a new column.
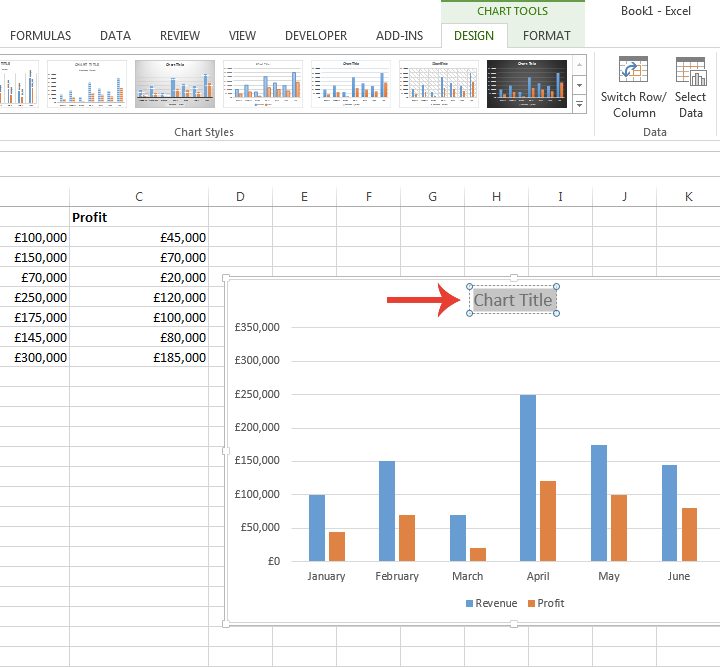
In the first screenshot of our instructions (see a few steps below) , we have entered a sample for demonstration purposes.
Step 2: Next, you’ll need to select the cells that contain all the data you wish to populate your graph with.
Step 3: Microsoft Excel provides a convenient feature that allows you to select from a number of templates for the graph. Click the Insert tab and then select Recommended charts.
Click a graph template of your choice and click OK.

Step 4: You can now customize the graph by changing its title (double-click Chart title), adjusting its size, its colors, etc. You can also alter the values in the table, and see how these impact the graph. If you don't want values to change, learn how to lock cells in Microsoft Excel.
With your new graph selected, select one of the following icons that appear next to it to customize your chart further:
- Plus-sign icon: To add or take away various chart elements like its labels or legend.
- Paintbrush icon: To change the color scheme or style of your graph.
- Filter icon: You can use this narrow down which data gets to be featured in your chart.
Step 5: For a complete list of all the graph types you can apply, click the All charts tab in the window that appears when you select the Recommended charts option from step 3. For example, you can select the Bar or Line charts, with each offering its own set of designs (3D, Clustered, Stacked, and more).

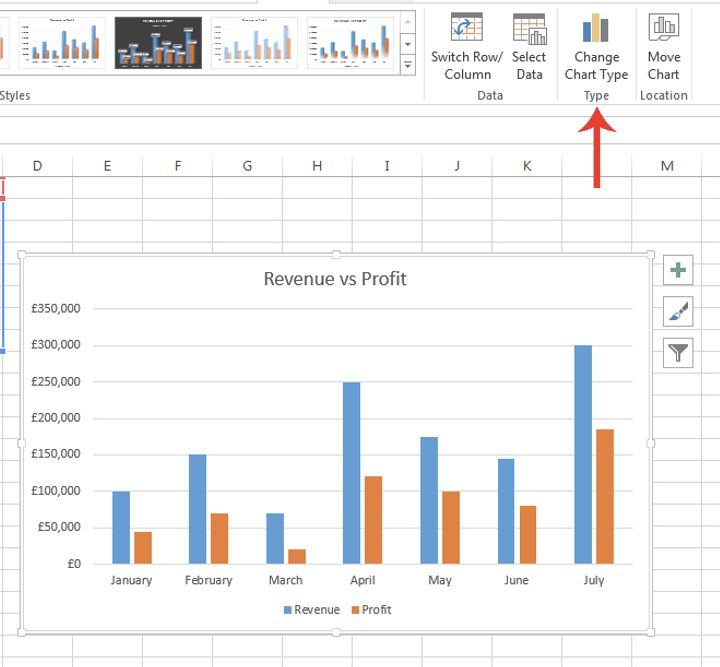
Step 6: If you wish to change the graph type after choosing one, simply choose the Chart design tab from the ribbon at the top of your screen and then select the Change chart type button.
(The Chart design tab usually only appears once your current chart is selected. So select your current chart first and then navigate to the Chart design tab that appears at the top of your screen.)
Step 7: You can also select a graph type from all the options within the section adjacent to the Recommended charts button on the Insert tab. Clicking the drop-down arrow next to each chart icon and hovering over a thumbnail contained within the menu that appears will show you a preview of what your chart will look like with that specific design.

Creating graphs is straightforward in Microsoft Excel. In fact, the process is so simple that other spreadsheet apps have more or less replicated it. So, it's one less thing to worry about if you can't make your mind up and are stuck trying to decide between Microsoft Excel and Google Sheets.