

Announced within the Official Gmail Blog earlier today, the development team behind Gmail has launched an analytics tool for email called Google Meter. Providing a variety of statistics for Gmail users, the tool analyzes email activity on a specific account on the first of each month. Google Meter provides data on volume of email, when emails flow in and out of the account, the most popular days the account receives email, percentages of messages based on the Gmail labeling system, average timing of responses, the average word length of emails and the typical length of an average email exchange. The tool formats this data visually within line graphs, bar graphs and pie charts.
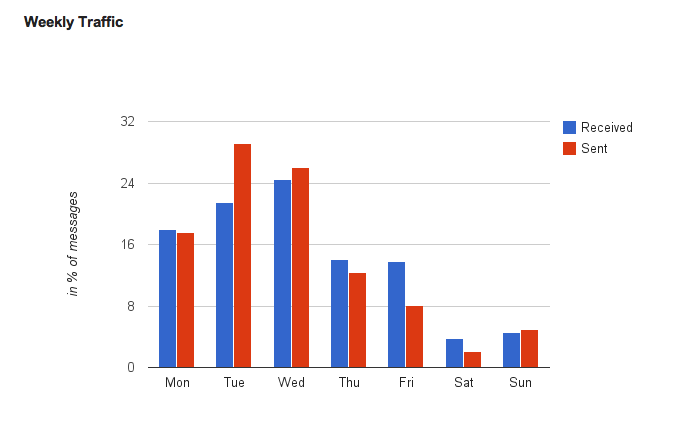 Regarding a real-world use, this data could be useful when planning to schedule an upcoming vacation. For instance, if email volume is greatest on Tuesday, Wednesday and Thursday for a particular user, extending a weekend by taking Friday and Monday off would be the least disruptive time of the week to take a break from work. It would also help the user pick the best days to check email when taking an entire week off.
This data could also help users improve their email response time and be wary of days that traditionally require more attention to the inbox. In addition, a user could combine the volume data and labeling data to determine the best locations to delete old email when attempting to free up space within the inbox.
Rather than including this new tool within Google Labs, the development team has made it accessible through Google Docs. After a user logs into a Gmail account, they open up a spreadsheet within Google Docs and click on Tools. After selecting Script Gallery, the user can search for “Gmail Meter” and install the script. After the script is installed, the user can click on Get a Report under the new Gmail Meter option on the spreadsheet. The user selects a type of report and allows the script to analyze emails within the inbox. Once the data have been compiled, the script sends an email to the user in order to alert the user about completion of the report.


