Something very strange is going on in the universe. The science of cosmology, which studies the universe on a grand scale, is in a state of crisis. Over the last century, scientists have found mountains of evidence that the universe is expanding over time, as they observed that the further away from Earth a galaxy is, the faster it is moving away from us.
The problem is that no one is sure how fast this expansion is happening. Two different ways of measuring this value, called the Hubble constant, produce two different results. The last decades have seen the best theories and experiments that humanity can come up with struggle to explain how this could be so.
Usually, when there’s a discrepancy like this, newer technologies enable more accurate experimental data which helps to solve the mystery. But in the case of this puzzle, called the Hubble tension, the more we learn, the harder it is to explain the discrepancy.
The cosmological distance ladder
When the Hubble Space Telescope was launched in 1990, one of its main aims was to investigate the expansion of the universe. The debate over the rate of this expansion was raging, and scientists were keen to pin down an answer more precisely — because this information was crucial to understanding the age of the universe, and at this time that age could have been as little as 8 billion years old or as much as 20 billion years.
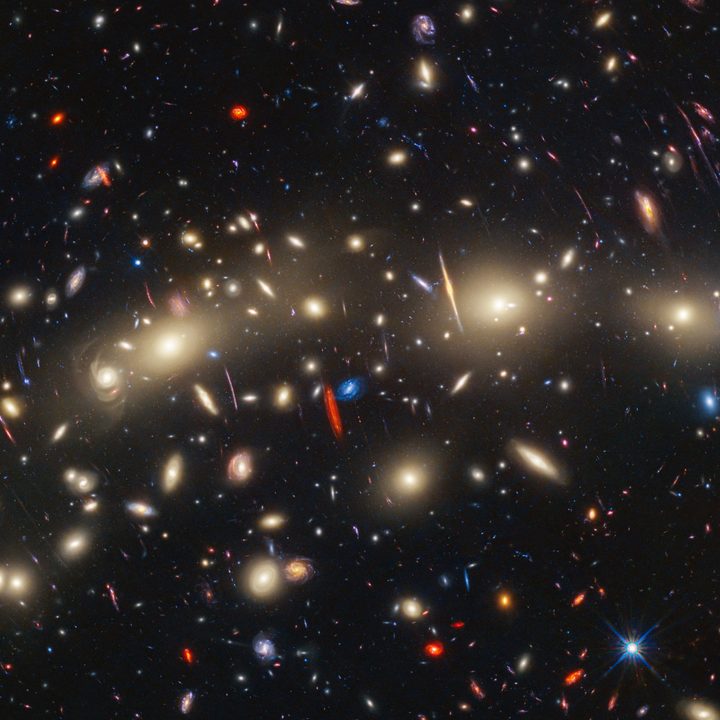
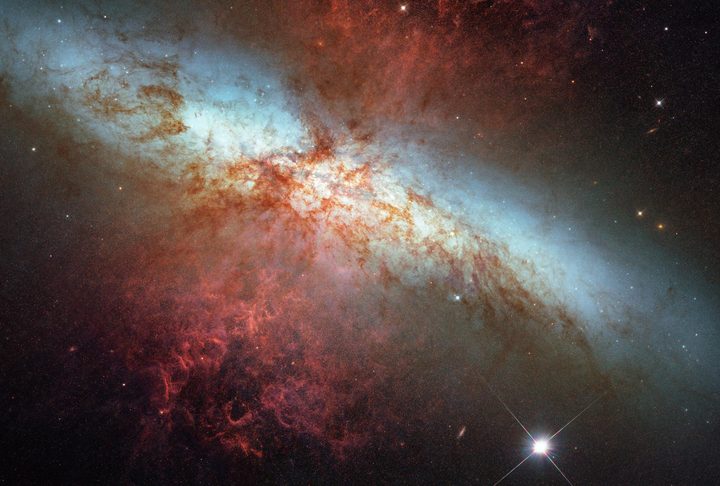
By the late 2000s, scientists had honed in on a figure by looking at stars that brightened in a particular rhythm, called Cepheid variables, and a particular type of supernova called Type Ia supernovae. Both of these objects have a predictable level of brightness, which means they can be used to measure distance — Cephids for closer galaxies and Type Ia supernovae for more distant ones — so they are used as “standard candles” for astronomical measurements.
With these accurate distance measurements, the value Hubble scientists came up with for the expansion of the universe was 72 kilometers per second per megaparsec. That’s a measurement of the amount of expansion by time by distance, because the further away from us galaxies are, the faster they are moving. A parsec is 3.26 light-years, and a megaparsec is one million parsecs. So if we look at a galaxy 3.26 million light-years away, it will be moving away from us at around 70 kilometers per second, or around 150,000 mph.
That measurement was an enormous scientific step forward, but it still had a potential error of around 10%. Subsequent research managed to chip away at reducing this error, honing in on a recent figure of 73.2km/s/Mpc with an error rate of under 2%, but they were bumping up against the physical limitations of the telescope.
A new telescope in the toolkit
While one group of astronomers was busy with data from the Hubble Space Telescope, another was looking in quite a different place, by examining the Cosmic Microwave Background, or CMB. This is the leftover energy remaining from the Big Bang and it’s seen everywhere as a constant very slight background hum. When calculating the Hubble constant based on this data, researchers found quite a different figure: 67 km/s/Mpc. That difference might seem small, but it’s stubborn: The more accurately each group made its measurements, the more entrenched the divide seemed.
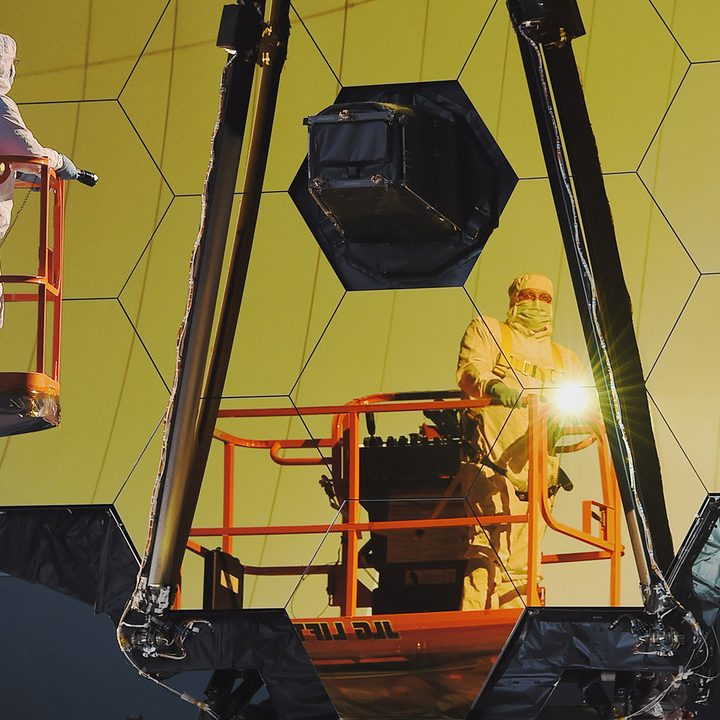
But when the James Webb Space Telescope was launched in 2021, researchers had a new and even more accurate tool for their measurements. A group of researchers including Richard Anderson of the Swiss Federal Institute of Technology Lausanne got to work double-checking Hubble’s measurements using this new technology. Perhaps the Hubble Space Telescope’s measurements had been inaccurate due to the limitations of the telescope, which might explain the different figures, and this new tool could help to show if that was the case.
The advantage James Webb has over Hubble in this context is greater spatial resolution when looking at Cephids. “Previously, when you had lower resolution you needed to statistically correct for the light of sources that blend together,” Anderson explained to Digital Trends. And this statistical correction introduced a nugget of doubt into the Hubble data. Perhaps the rate of expansion measured by Hubble was inaccurate, some argued, because the statistical tools used for this correction were inaccurate.
With the better spatial resolution of new Webb data, though, that statistical correction is much smaller. “So if you don’t have to correct so much, you add less error, and your measurement becomes more precise,” Anderson said. Not only does the Webb data agree with the previous Hubble measurements, but it increases the precision of that measurement too.
The evidence is in, and it’s clear: Hubble’s measurements of the rate of expansion are correct. Of course, nothing this complex can be proved beyond any shadow of doubt, but the measurements are as accurate as we can practically make them.
A sticky problem
So if the Hubble telescope data is correct, maybe the problem is with the other measurement. Maybe it’s the Cosmic Microwave Background data that is wrong?
That’s tough too, however. Because just as researchers were refining the figure from Hubble data, so too the CMB researchers were making their own figure more and more accurate. The biggest step forward in this field was the launch of the European Space Agency’s Planck space observatory in 2009. This mission was specifically designed to measure the CMB and it acquired the most accurate data yet of the small variations in temperature across the CMB. That’s important because although the CMB is at a consistent temperature almost everywhere, there are tiny variations in this temperature of 1 part in 100,000.
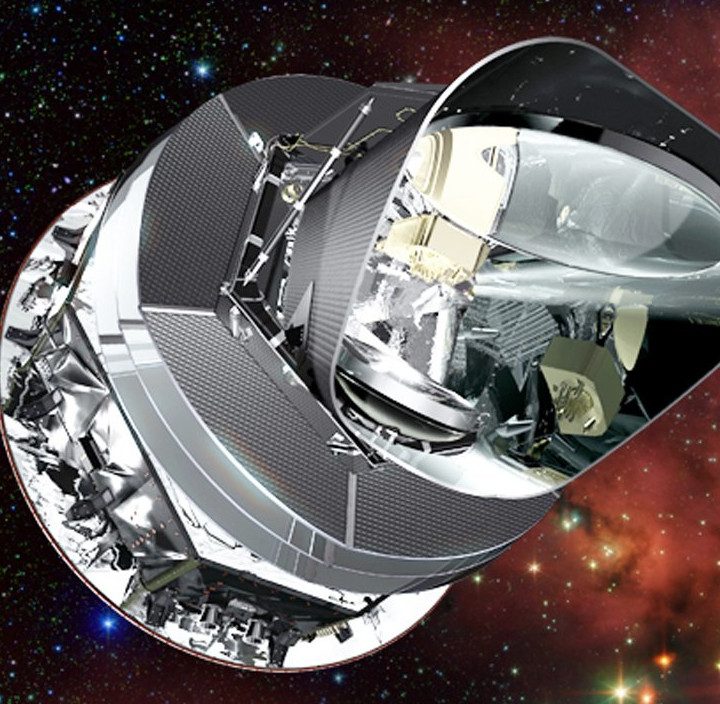
As small as these temperature variations are, they are important because they represent variations that were present when the universe was forming. Looking at the variations as they exist now, researchers can roll back the clock to understand what the universe must have looked like in its earliest stages.
When researchers use this Planck data to estimate the expansion of the universe, based on our understanding of the universe as it existed when it was young, they honed in on a figure for the constant of 67.4 km/s/Mpc with an error of less than 1%. There’s no crossover between the uncertainties of the two figures anymore — they’re both solid, and they don’t agree.
A history of expansion
Scientists have been studying the CMB since the 1960s, and in that time the research has progressed to a degree of precision that makes its specialists confident in their findings. When it comes to modeling the inflation of the universe in its early stages, they have gotten about as accurate as possible according to Jamie Bock of Caltech, PI for NASA’s upcoming SPHEREx mission to investigate the CMB.
“The microwave background is very close to hitting cosmological limits on those measures,” Bock said. “In other words, you can’t build a better experiment. You’re just limited on how much of the universe you can see.”
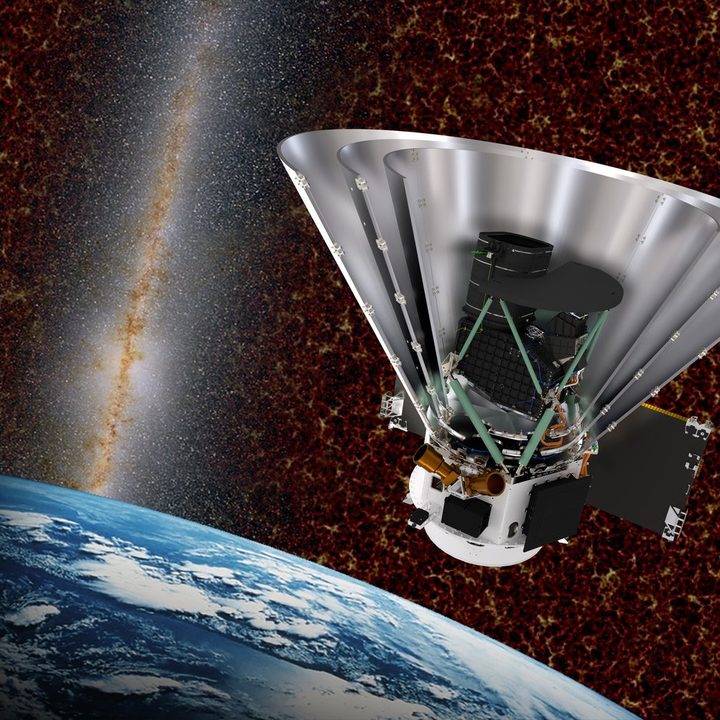
SPHEREx will be a space-based mission that won’t take direct measurements of the Hubble constant. But it will help researchers learn about the history of the universe’s expansion, by investigating a period of the early universe called inflation when the universe expanded rapidly. In this very early period, the universe was much, much smaller, hotter, and denser, and that affected the way in which it expanded. Over its lifetime, the most significant driving factors of the universe’s expansion have changed as it has grown, cooled, and become less dense. We know that today, a hypothesized form of energy called dark energy is the main force pushing the universe to expand. But at other times in the universe’s history, other factors such as the presence of dark matter have been more significant.
“The trajectory of the universe is set by the type of matter and energy that are dominant at that time,” Bock explained. Dark energy, for example, “has only started to dominate the expansion of the universe in the latter half of the age of the universe. Prior to that, it would have been dark matter that would drive the evolution of the universe.”
One popular theory for the difference in the two measurements is that dark energy could be the culprit. Perhaps there was more dark energy in the early universe than is currently believed, which would make it expand faster. We might learn more about this possibility with new missions like ESA’s Euclid, which launched recently and aims to map a huge chunk of the universe in 3D to study dark matter and dark energy.
A thermometer for our understanding of the universe
You can think of the two values of the Hubble constant as measuring from the universe as we see it now, called the late universe, compared to measuring from the universe as it was when it was young, called the early universe. When the two different rates were calculated using less accurate methods, it was possible that the two could actually be in agreement but just appeared further apart due to overlapping errors.
But as scientists have reduced these errors down and down, that explanation can’t work anymore. Either one of the measurements is wrong — always possible, but increasingly unlikely given the mountain of data on each — or there’s something fundamental about the universe that we just don’t understand yet.
“The thermometer tells us that we have a fever.”
“What we have here is like a thermometer of how good our understanding is of the cosmos at this time,” Anderson said. “And I think the thermometer tells us that we have a fever, and we have a problem.”
And bear in mind, the Hubble constant isn’t a minor issue. It’s a fundamental measurement, arguably the most important number in cosmology. And the more accurate our measurements of it get, the more the mystery deepens.
Searching for independent verification
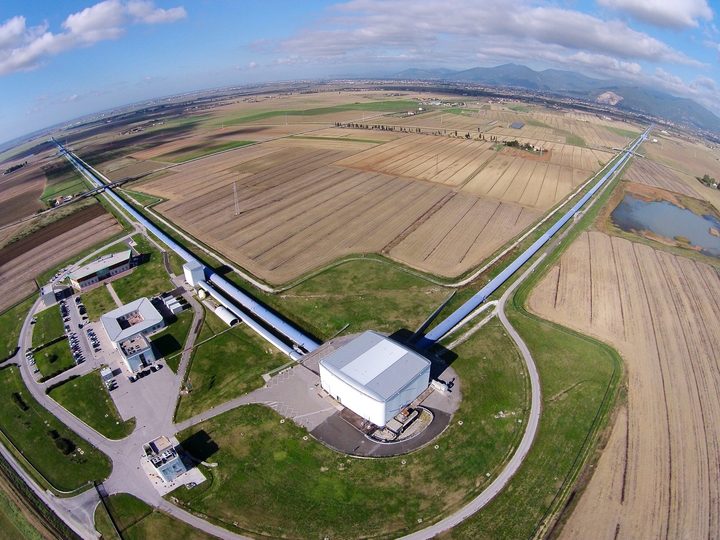
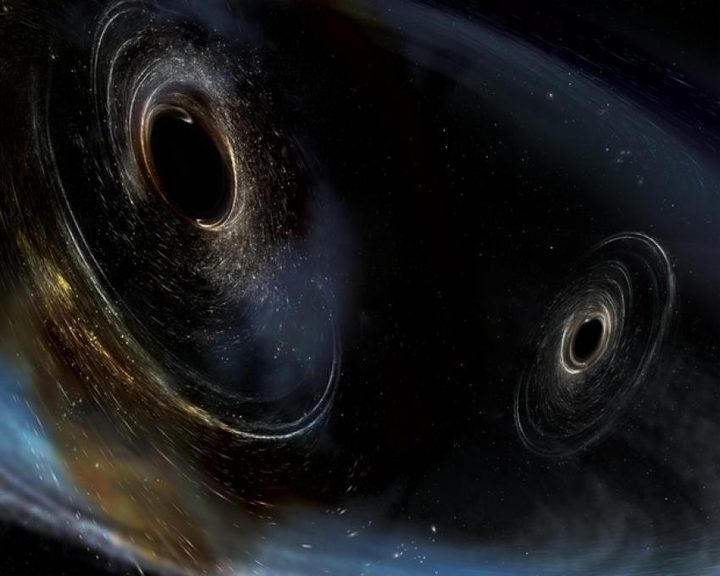
This is another way of measuring the universe as we see it now, and that’s by looking at gravitational waves. When massive enough objects collide, such as two black holes merging, the enormous forces create ripples in spacetime called gravitational waves, which can be detected from billions of light-years away.
These ripples can be detected on Earth by specialized facilities like LIGO (the Laser Interferometer Gravitational-Wave Observatory) and can be used to determine how far away a source is, which means they can theoretically be used to measure the rate of expansion as well.
This is a late universe measurement, but it’s also completely independent of the Cephids and supernovas used in other research. That means that if measurements of the expansion rate appear similar based on gravitational wave data, we could be even more confident that the higher figure is correct — and if they don’t, then we’d know better where the problem is.
The advantage of using gravitational waves for this type of measurement is that the signature is very clean — “the only thing that affects it is very heavy masses,” said gravitational wave expert Stefan Ballmer of Syracuse University. And when black holes merge, their dynamic behavior is very consistent, no matter their size. That makes them ideal standard candles for measuring distances — “about as good as it gets,” according to Ballmer.
So measuring distance with gravitational waves is relatively simple. The challenge with using these measurements for calculating the expansion rate is finding the velocity. With supernovas, it’s easy to know the redshift (which gives you the velocity) but hard to know the absolute brightness (which gives you the distance). Whereas with gravitational waves it’s easy to know the distance but hard to know the velocity.
One way of approaching the velocity issue is to look for mergers happening in nearby galaxies, and then use the known redshift of those galaxies for your gravitational wave velocity. This only works when you can find the source of gravitational waves and pinpoint it to somewhere close by.
But in the future, once scientists observe enough of these gravitational wave events, they’ll be able to build up a picture of what the average event looks like and use that information to calculate the expansion rate on a large scale.
The next generation of facilities
For that, though, we’ll need hundreds of data points on gravitational wave events, compared to the handful we have now. This is a very new area of research, and our ability to detect gravitational waves is still limited to a small number of facilities. Currently, the uncertainties of the expansion rate measured using gravitational waves are still larger than the two other methods.
“Right now, our signal lies right in the middle between the two other results,” Ballmer said.
However, that could change in the future. With the next generation of gravitational wave detectors, being planned for construction in the next decades, these measurements could become more and more accurate.
The deepening of this puzzle might be a source of frustration, but it’s also given an impetus for new and better experiments as scientists from a wide range of fields tackle one of the great questions about the universe as we see it.
“The only way to really know is to make the experiment better,” Ballmer said. “That’s the world we live in.”